21 June 2023
This report follows an article published in November 2022 that showed Direct Debit Rejection (DDR)1 rates were increasing across our portfolio, even as the rate of mortgages in arrears remained steady.
It is important to note at the outset that our portfolio has a higher composition of borrowers who qualify for a discounted mortgage rate, and are therefore more likely to be acutely impacted by the cost-of-living crisis, than the broader UK mortgage market. Our data reflects this concentration.
Direct Debit Rejections climb by one third
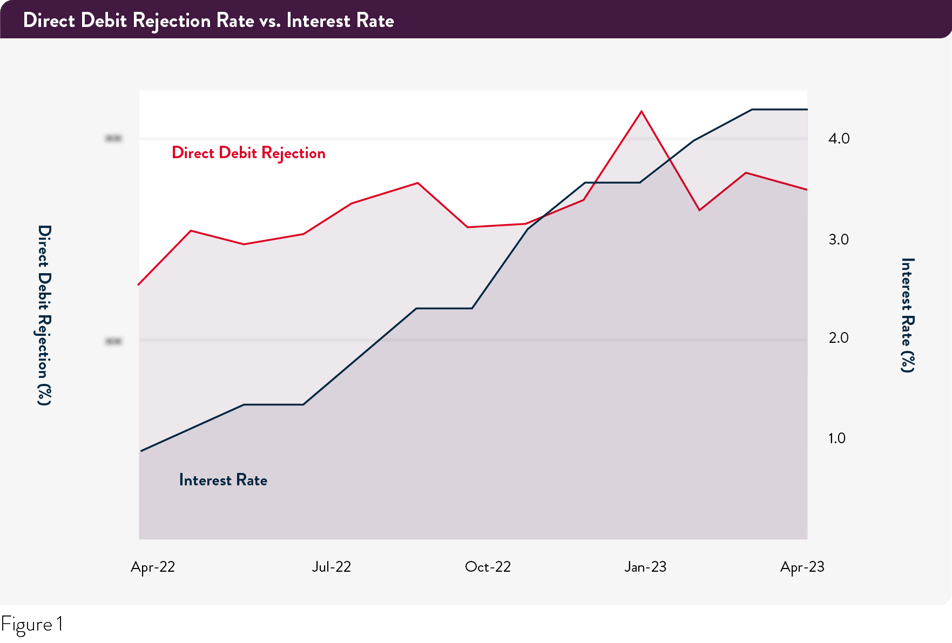
Across Pepper Advantage’s UK portfolio, the percentage of residential mortgages that experienced a Direct Debit Rejection grew 33.3% in April 2023 compared to April 20222. A direct debit rejection typically occurs as a result of insufficient funds at the time the direct debit is called. A borrower who experiences a DDR may fall into early arrears but can often manage for a period of time, which is why there is an assumed lag between rising DDR rates and rising rates of arrears, indicating more challenges to come.
This assumption is matched by analysis from the Resolution Foundation, which published a report in May that estimated “only half of the households that will eventually be impacted [by rising interest rates] have been impacted so far and only a third of the mortgage pain they will collectively bear has been felt”3.
“ We anticipate the continued rising interest
rate environment means we will see further
deterioration in DDRs”
Gerry McHugh, CEO, Pepper UK
A twelve month view of our UK residential mortgage portfolio (figure 1) shows a generally upward trend in DDRs alongside rising interest rates. The DDR rate spiked in January, a month that typically sees a seasonal increase following the Christmas holidays. The peak seen in January 2023 represents an all-time high4.
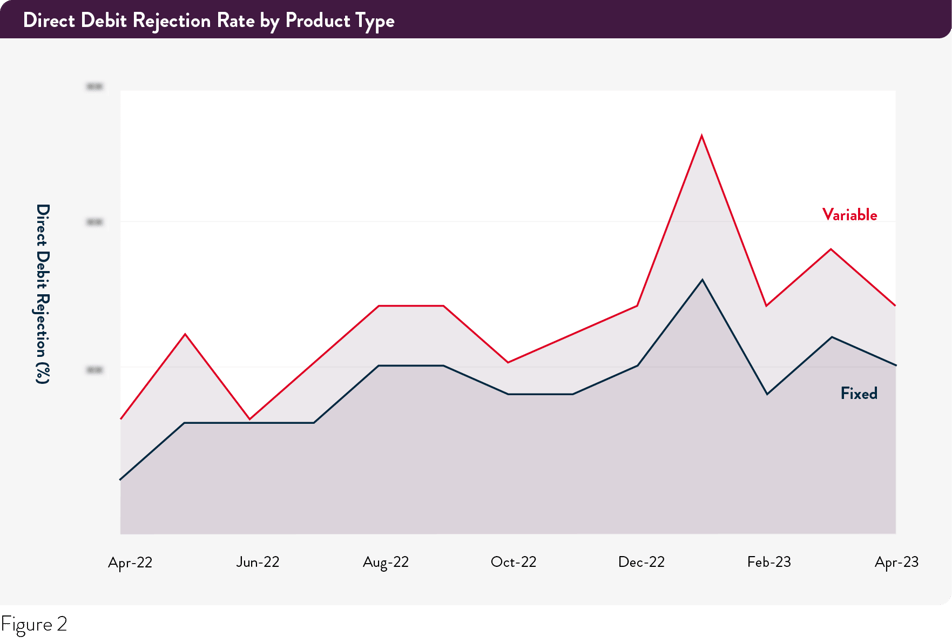
Looking at Direct Debit Rejections over the 12 months to April 2023 across different mortgage types (figure 2) reveals that the percentage of fixed rate and variable rate mortgages with a DDR grew 36.4% and 30.8%, respectively, although variable rate mortgages had an overall higher rate of DDRs.
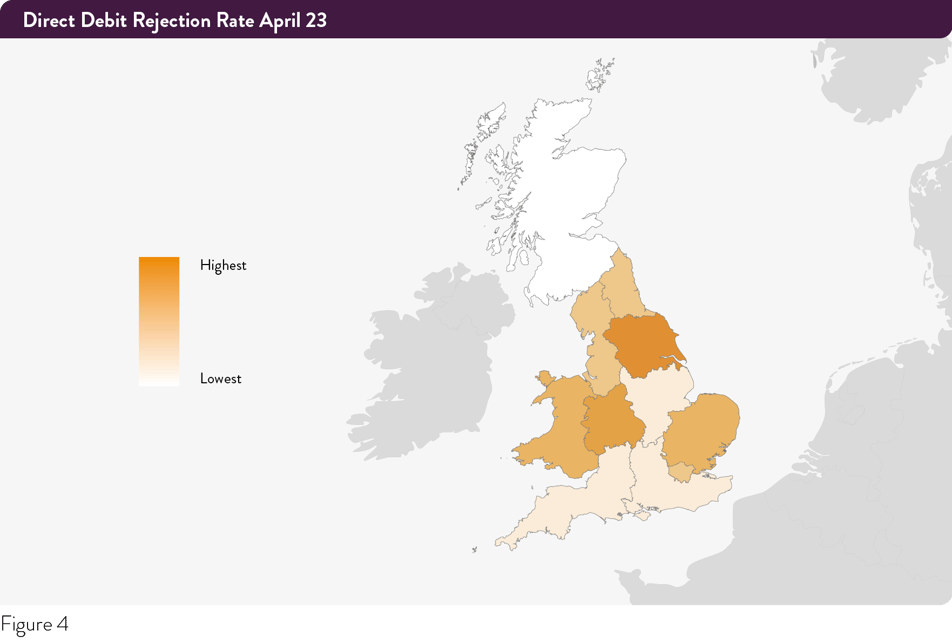
A regional look shows an overall increase in DDR rates across Britain over the last 12 months (figure 3)5.
East Anglia saw the highest year-on-year growth in its DDR rate (54.5%), followed by the West Midlands (50%) and Greater London (45.5%), respectively.
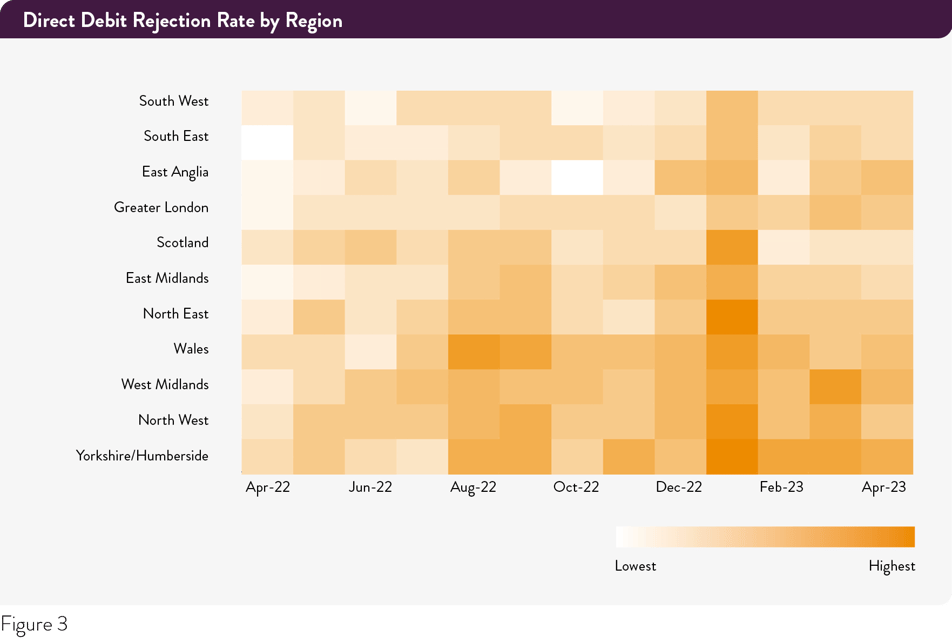
The heat map (figure 4) shows which regions had the highest and lowest direct debit rejection rates in April 2023. Yorkshire and Humberside shows the highest absolute rate of DDRs followed by the West Midlands. Scotland, by contrast, had the lowest absolute DDR rate, followed by the South East, South West, and the East Midlands.
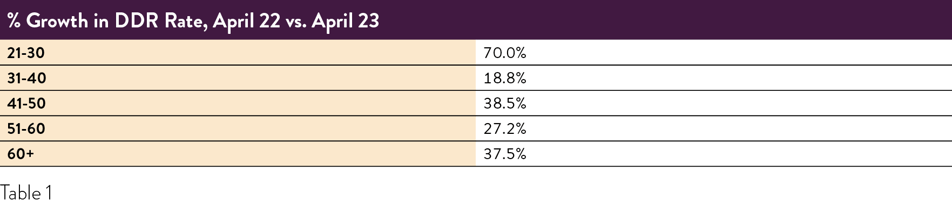
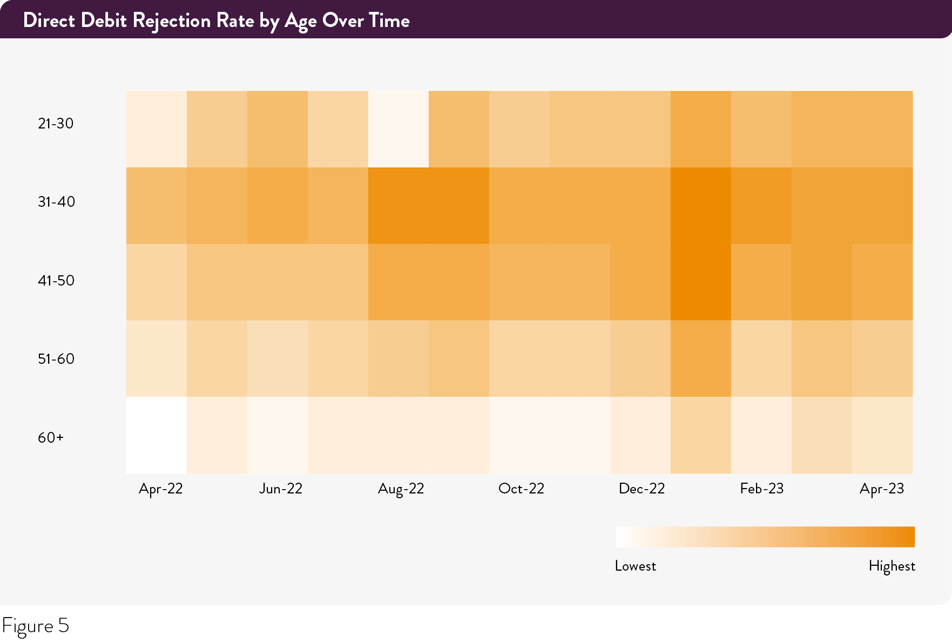
An age breakdown shows that younger generations (21-30 age group) saw the highest year-on-year increase in DDR rates, 70% compared to 19%-38% for other age categories (Table 1).
However, while the youngest age cohort saw the largest growth in DDR rates, their overall rate of DDRs remained in line with other groups.
Arrears now on the rise
In November, we reported that our arrears rate remained steady despite rising DDRs. This is no longer the case. The percentage of residential mortgages in arrears across our UK portfolio in April 2023 increased 11.3% year-on-year6, the highest growth rate since the global financial crisis. Again, it is important to reiterate that our portfolio has a higher concentration of borrowers who qualify for a discounted mortgage rate than the broader market.
 Looking across mortgage types shows that the percentage of fixed and variable rate mortgages in arrears grew 35.7% and 25.1%, respectively, although variable rate mortgages show a significantly higher overall rate of arrears. Approximately one in five of our variable rate mortgage borrowers registered one or more delinquent payments in the last five months.
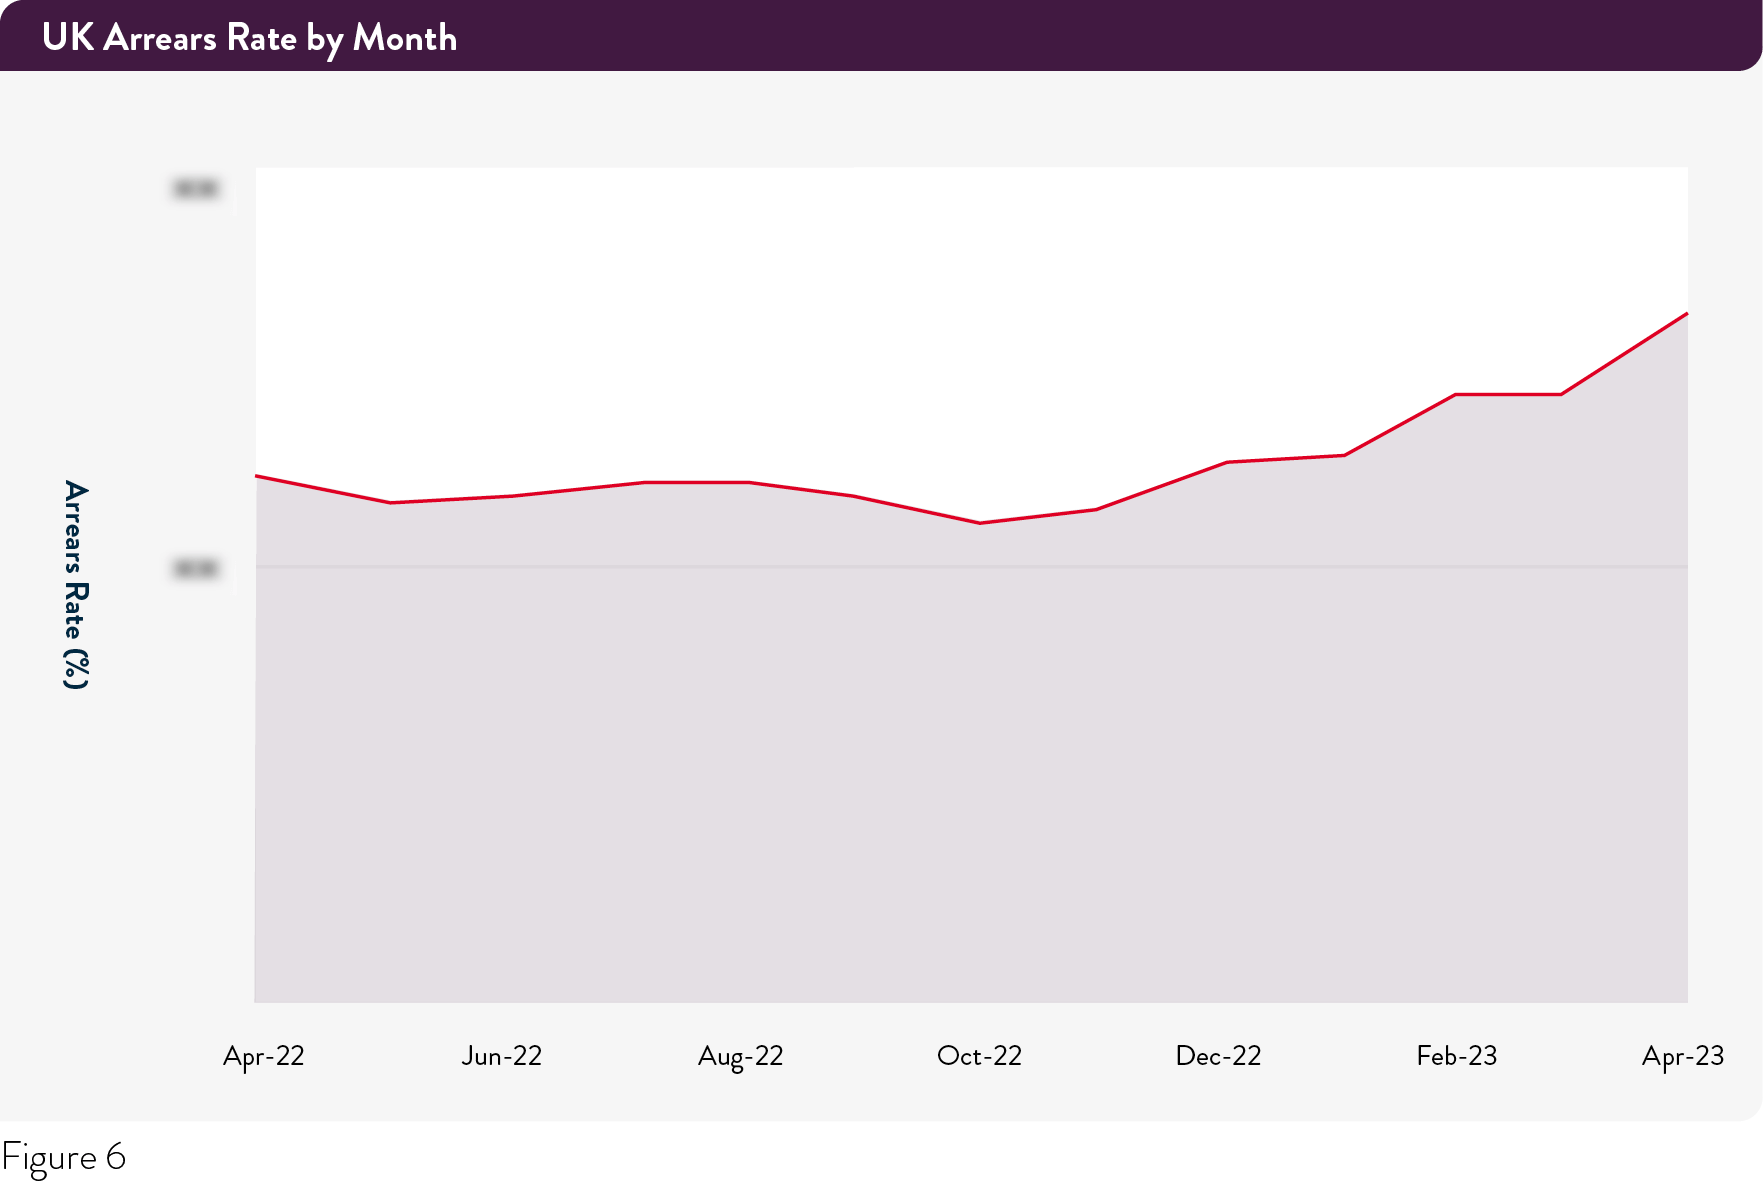
As seen in the charts above, arrears remained steady throughout most of 2022, helped by the remains of household savings built up during the COVID-19 pandemic. Continued high inflation, however, has eaten away at these reserves; the annual UK inflation rate was 10.1% in March 2023 according to the Office for National Statistics (ONS), compared to 5% in the US and 6.9% in the Eurozone. The inflation rate for housing, water, electricity, and fuel in the UK was 11.6%7.
“ Customers are experiencing heightened
pressures due to interest rate increases.
These are compounded by rising inflation,
impacting household bills”
Gerry McHugh, CEO, Pepper UK
According to UK Finance’s Household Finance Review, cost pressures contributed to Q1 2023 seeing “the first contraction in the aggregate level of deposits as households accessed savings built up through the Covid-19 era […] to cover higher monthly spends"8.
We are now seeing the sustained pressures on household budgets rippling through to mortgage payments. The percentage of mortgages in arrears began to creep up in December, reflecting rising UK interest rates following the market turmoil in September. It has been rising every month since, with the most dramatic increase thus far occurring in April 2023 (figure 6).
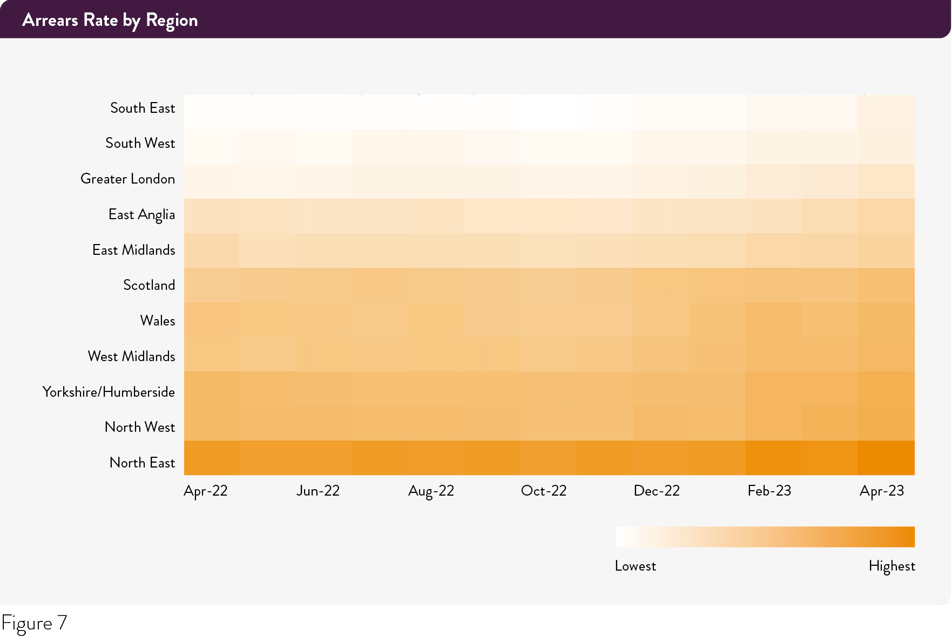
A geographic breakdown shows rising rates of arrears across all regions9 (figure 7).
Our data shows that parts of Britain are struggling more than others, with the North East (over 10%) and the North West (just under 10%) seeing the highest percentages of mortgages in arrears. Greater London has a relatively low arrears rate around 5%, but this figure represents the largest yearly growth of any region: 23.8% higher compared to April 2022.
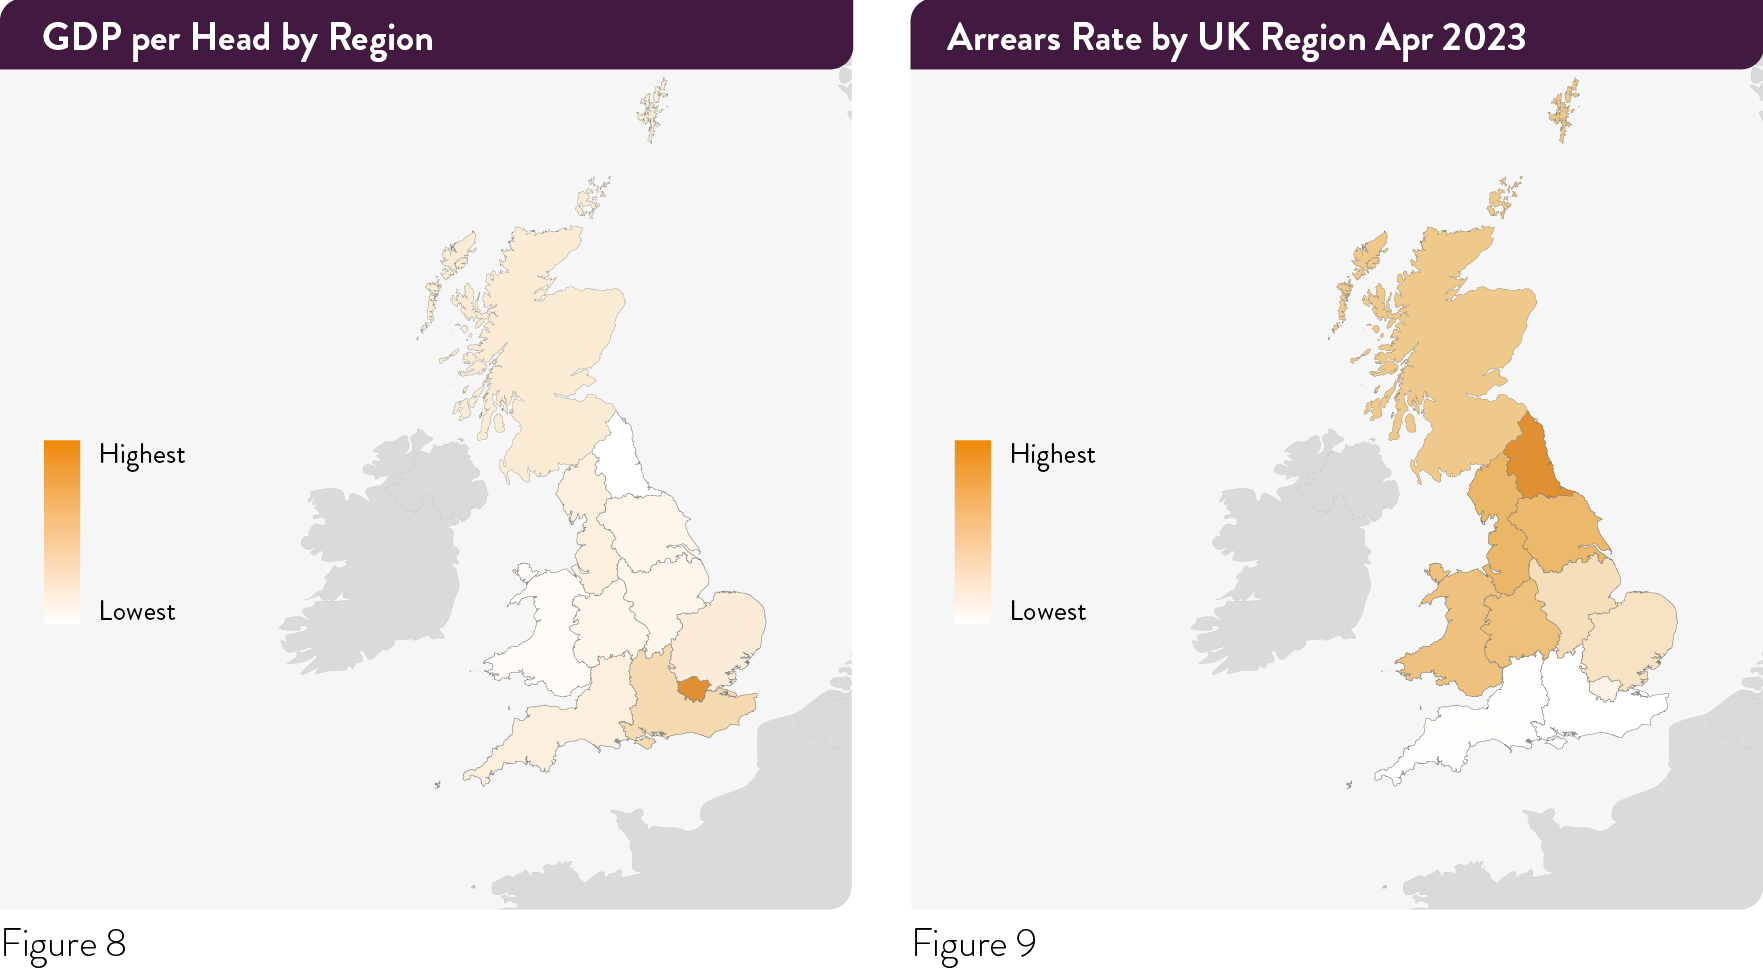
We can analyse these figures alongside the latest regional GDP data (figure 8) to show correlations between relatively low regional GDP per head and relatively high rates of arrears (figure 9)10.
While we stress that correlation does not equal causation, we note that our ability to map our data to regional GDP information allows us to see where the risk of arrears might be highest given broader economic factors.
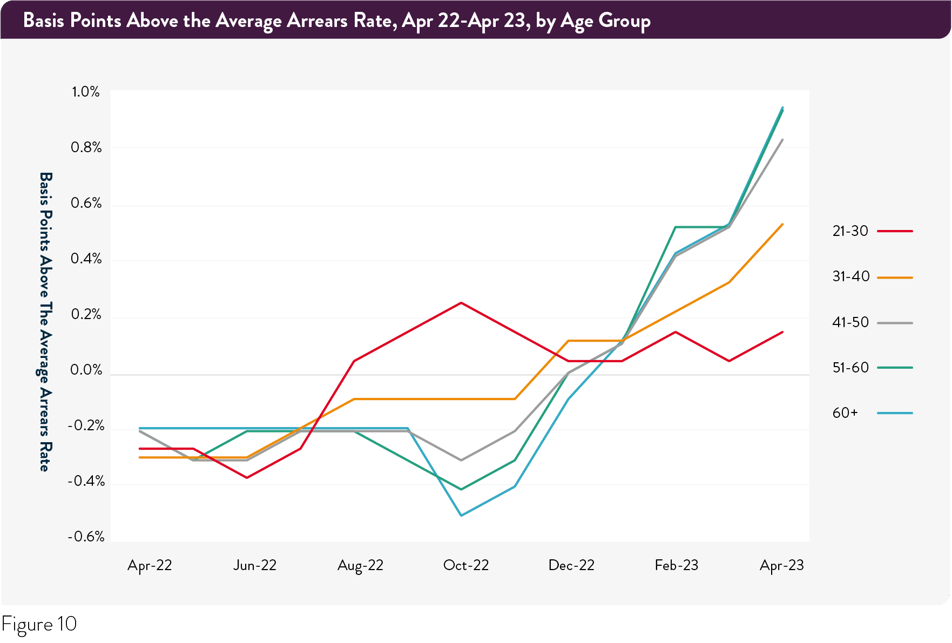
An age breakdown (figure 10) suggests that cash reserves for all age groups are running dry, with younger age demographics hit first. The percentage of mortgages in arrears for borrowers aged 21-30 jumped in August 2022. A comparable jump was seen in December 2022 for those aged 31-40, 41-50, and 51-60, whilst those aged 60+ were hit in January 2023.
Notably, the 41-50, 51-60, and 60+ age groups saw another jump in February, while the four age groups from 31-60+ saw a subsequent increase in April 2023.
This assumption is supported by growth rates in the percentage of mortgages in arrears, with the two youngest age brackets seeing year-on-year increases of 50% and 42.1%, respectively. These figures compare to a more modest 20% (41-50), 14.9% (51-60), and 13.8% (60+) for older groups.
What next?
Pepper Advantage is able to use this data to identify UK borrowers who could be struggling earlier than was previously possible. Analysing risk factors such as current and forward-looking macroeconomic indicators, location, age, employment situation, and/or Loan to Value ratio allows us to build strategies with customers before problems escalate in the hopes of keeping mortgages in good standing. In the UK, these strategies include:
 Concessional Arrangements to Pay
Where the borrower pays an amount that is less than their contractual monthly instalment. This is most often used in instances of short-term financial difficulty, such as illness or unemployment, and a reduced, or even nil, payment gives the customer time when it is most needed.
 Term Extension
Where the loan term is extended to give the borrower additional time to repay an interest-only mortgage. Similar to concessional arrangements to pay, term extensions are often used when a borrower’s circumstances or financial situation has temporarily changed.
 Payment Holiday
Where a borrower takes a temporary break from paying all or part of a mortgage for an agreed period. Payment holidays are often used to help borrowers cope with a short-term or unexpected change in their situation.
 Short Term interest-only mortgage
Where a mortgage is converted from capital repayment to interest-only for a fixed period. Similar to interest rate reductions, this strategy is often used to help reduce monthly mortgage payment amounts for a period of time, providing more stability.
 Interest Rate Reduction
Where the interest rate applied to the account is reduced for an agreed period. This is most often used in instances where the customer is experiencing longer-term financial stress and a reduction in the contractual rate will help provide borrowers with greater certainty in terms of meeting their monthly payments.
“ Analysing risk factors allows us to build
strategies with customers before problems
escalate, minimise impact and work together
to get the best possible outcome."
Gerry McHugh, CEO Pepper UK
Taken together, these strategies help us intervene when borrowers face financial stress. Our credit intelligence platform allows us to aggregate and analyse data more effectively, which helps us deploy the insights we derive earlier and in a more targeted fashion than was previously possible.
This data also gives us the ability to model the impact further economic challenges and interest rate rises could have on customers across our portfolio. Our analysis indicates that the scale of challenges facing UK borrowers is only now starting to appear, which makes the insights we derive from this data, and the steps we take as a result, ever more important.
Why Pepper Advantage?
Pepper Advantage is a global credit intelligence company that offers a range of data led and credit management services via a technology platform that spans Asia, Europe, and the United Kingdom. The company operates in multiple asset classes including residential and commercial mortgages, real estate, SME loans, asset financing and leasing, auto and consumer loans, credit cards, retail finance and BNPL, in addition to offering a number of outsourced operational support services to both financial and non-financial clients. It helps investors, financial institutions, fintechs, and banks manage their credit portfolios, reducing the cost and complexities of systems and supporting new non-bank lending, with a particular focus on clients whose customers are underserved by traditional mainstream lenders.
Pepper Advantage's Credit Intelligence platform transforms real-time global data and analytics into valuable information, so that you can make insight-driven decisions to benefit your business and your customers’ financial experiences.
It removes the guesswork, the static spreadsheets, the disconnected tools, and allows for rational portfolio management in a fast-changing world.
To find out more about Pepper Advantage and our Credit Intelligence platform, click here.
Trusted by
Our clients range from some of the most established and recognised incumbents in the world to new challengers and fintechs. We service private equity and institutional investors, hedge funds, major banks, property developers, fintechs, non-bank lenders and retailers. We manage 125 institutional clients – a number that continues to grow, having increased by 40% since December 2022.


-
DDRs are defined as a direct debit that has been processed by the creditor, but payment has not been received, accepted, or settled into the creditor’s account.
-
Growth rates represent growth in the percentage of mortgages with a DDR from April 2022 to April 2023.
-
https://www.resolutionfoundation.org/publications/macroeconomic-policy-outlook-q2-2023
-
The January 2023 peak reflects current trends, although it is important to note that more mortgages are paid by direct debit now than during the financial crisis, which is a contributing factor to January setting a record high.
-
Please note that Northern Ireland, Guernsey, Jersey, Isle of Man are excluded due to small sample sizes.
-
Growth rates represent growth in the percentage of mortgages in arrears from April 2022 to April 2023. Mortgages in arrears are those that are 30+ days delinquent in payment.
-
https://www.ons.gov.uk/economy/inflationandpriceindices/bulletins/consumerpriceinflation/march2023
-
https://www.ukfinance.org.uk/system/files/2023-06/Household%20Finance%20Review%202023%20Q1.pdf
-
Please note that Northern Ireland, Guernsey, Jersey, Isle of Man are excluded due to small sample sizes.
-
Most recent GDP per head data (2021) at current market prices: https://www.ons.gov.uk/economy/grossdomesticproductgdp/datasets/regionalgrossdomesticproductallnutslevelregions
Disclaimer
The material contained in this Article (the “Material”) has been prepared by Pepper Advantage Technologies Limited (“Pepper”).
No representation or warranty, express or implied, is or will be made with respect to the accuracy, completeness, usefulness or merchantability of the Material or its fitness for a particular purpose or regarding the accuracy of the assumptions or the output or the appropriateness of the parameters used in the calculation of any projections or estimates set out herein or the correlation of the data to the actual or expected performance and characteristics of any transaction and no liability or responsibility is or will be accepted by Pepper or any of its affiliates or associated companies or any of their respective directors, officers, employees or agents in relation thereto. Any use of the Material by the Recipient for any purpose whatsoever will be entirely at the Recipient’s own risk.
This Material may utilise information which has not been independently verified and may include that from public sources and third parties (including market and industry data). Further, this Material may contain forward-looking statements, estimates, forecasts and projections that may be affected by inaccurate assumptions, expectations and estimates and by known or unknown risks and uncertainties are predictive in character and inherently speculative and may or may not be achieved or prove to be correct. The Recipient should not place reliance on such statements.
By accepting the Material, the Recipient acknowledges that (a) Pepper is not in the business of providing advice including legal, tax or accounting advice, (b) there may be financial, legal, tax or accounting risks associated with any transaction, (c) it will seek advice from advisors with appropriate expertise to assess relevant risks and independently determine, without reliance upon Pepper, the economic risks and merits of any transaction and that it is able to assume any such risks and that (d) nothing herein shall form the basis of or be relied on in connection with any contract or commitment whatsoever and neither Pepper nor any of its agents accept liability for any loss howsoever arising, whether direct or consequential, from, related to or in connection with any use of the Material or otherwise arising in connection herewith.
Your receipt and use of the Material constitutes notice and acceptance of the foregoing.